Ocean salinity: Climate change is also changing the water cycle
D-USYS
As the Earth is warming, the global water cycle amplifies. Researchers from the Chinese Academy of Science, ETH Zurich, the American National Center for Atmospheric Research, the University of St. Thomas and the Pennsylvania State University studying ocean salinity have found strong evidence of a substantial amplification of in the past 50 years.
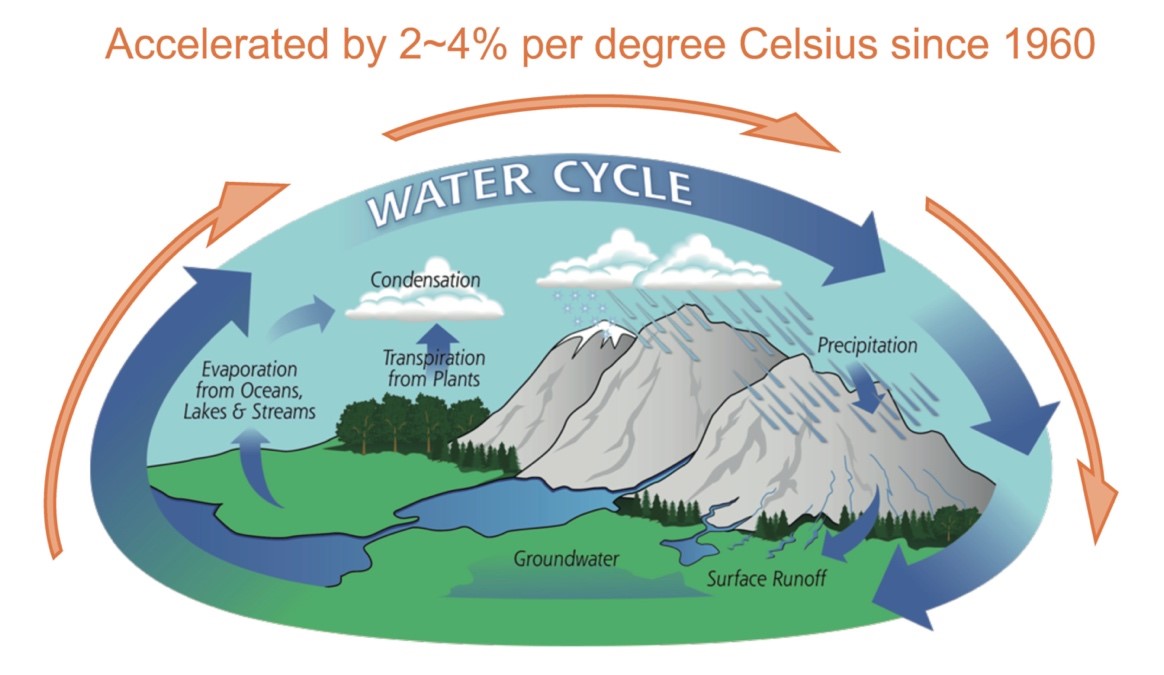
Accelerated by 2~4% per degree Celsius since 1960
Water and its movements within or between atmosphere, land, and ocean defines the global water cycle, which is a central element of Earth’s climate system (Figure 1). Almost all weather and climate phenomena are in some way tied to the water cycle. Examples include extreme rainfall during thunderstorms, hurricanes and tropical cyclones, flooding, droughts, and sea level rise.
As the climate changes, the water cycle is changing in important ways as well. Theory and models suggest that as the Earth is warming, the global water cycle amplifies, i.e., more water is evaporated from the ocean, and consequently precipitation is increasing as well. Yet the observational confirmation of this prediction has been difficult, since past changes of the water cycle were poorly observed due to the difficulty of measuring global-scale evaporation and precipitation and the complexity of their spatial and temporal variability.
The meaning of salinity change
The study, published in Journal of Climate, overcomes many of the previous limitations, and derives an estimate of water cycle change based on a new salinity data product since 1960. From this, they provided strong evidence that the global water cycle has amplified substantially in the past 50 years, confirming theory and models. The study is led by Lijing Cheng from Institute of Atmospheric, Chinese Academy of Sciences, who collaborated with a group of international scientists from National Center for Atmospheric Research, U.S.; University of St. Thomas, U.S.; Pennsylvania State University, U.S, and ETH Zurich, namely Prof. Nicolas Gruber from the Department of Environmental Systems Science.
Changes in ocean salinity change can be used to estimate changes in Earth’s water cycle, because salinity variations very sensitively reflect the net exchange of freshwater between the ocean and the atmosphere. “Evaporation takes freshwater from the ocean into the atmosphere and increases the ocean salinity; precipitation puts freshwater into the ocean and reduces its salinity. Consequently, salinity changes integrate effects over broad areas and provide an excellent indicator for water cycle change.” Lijing Cheng introduced.
Monthly gridded salinity fields deliver more accurate data
A number of previous studies have followed this approach, but their conclusions were limited by the fact that the underlying salinity datasets were subject to biases or limited to just the surface ocean. This new study provides new monthly gridded salinity fields for the upper 2000 m since 1960. “The new product is clearly more reliable for examining long-term salinity changes, as we show that this new salinity reconstruction has much better continuity through changes in the observing-system (from altimeters on satellites and profiling floats (Argo) in the ocean.” a co-author, Kevin Trenberth from NCAR said.
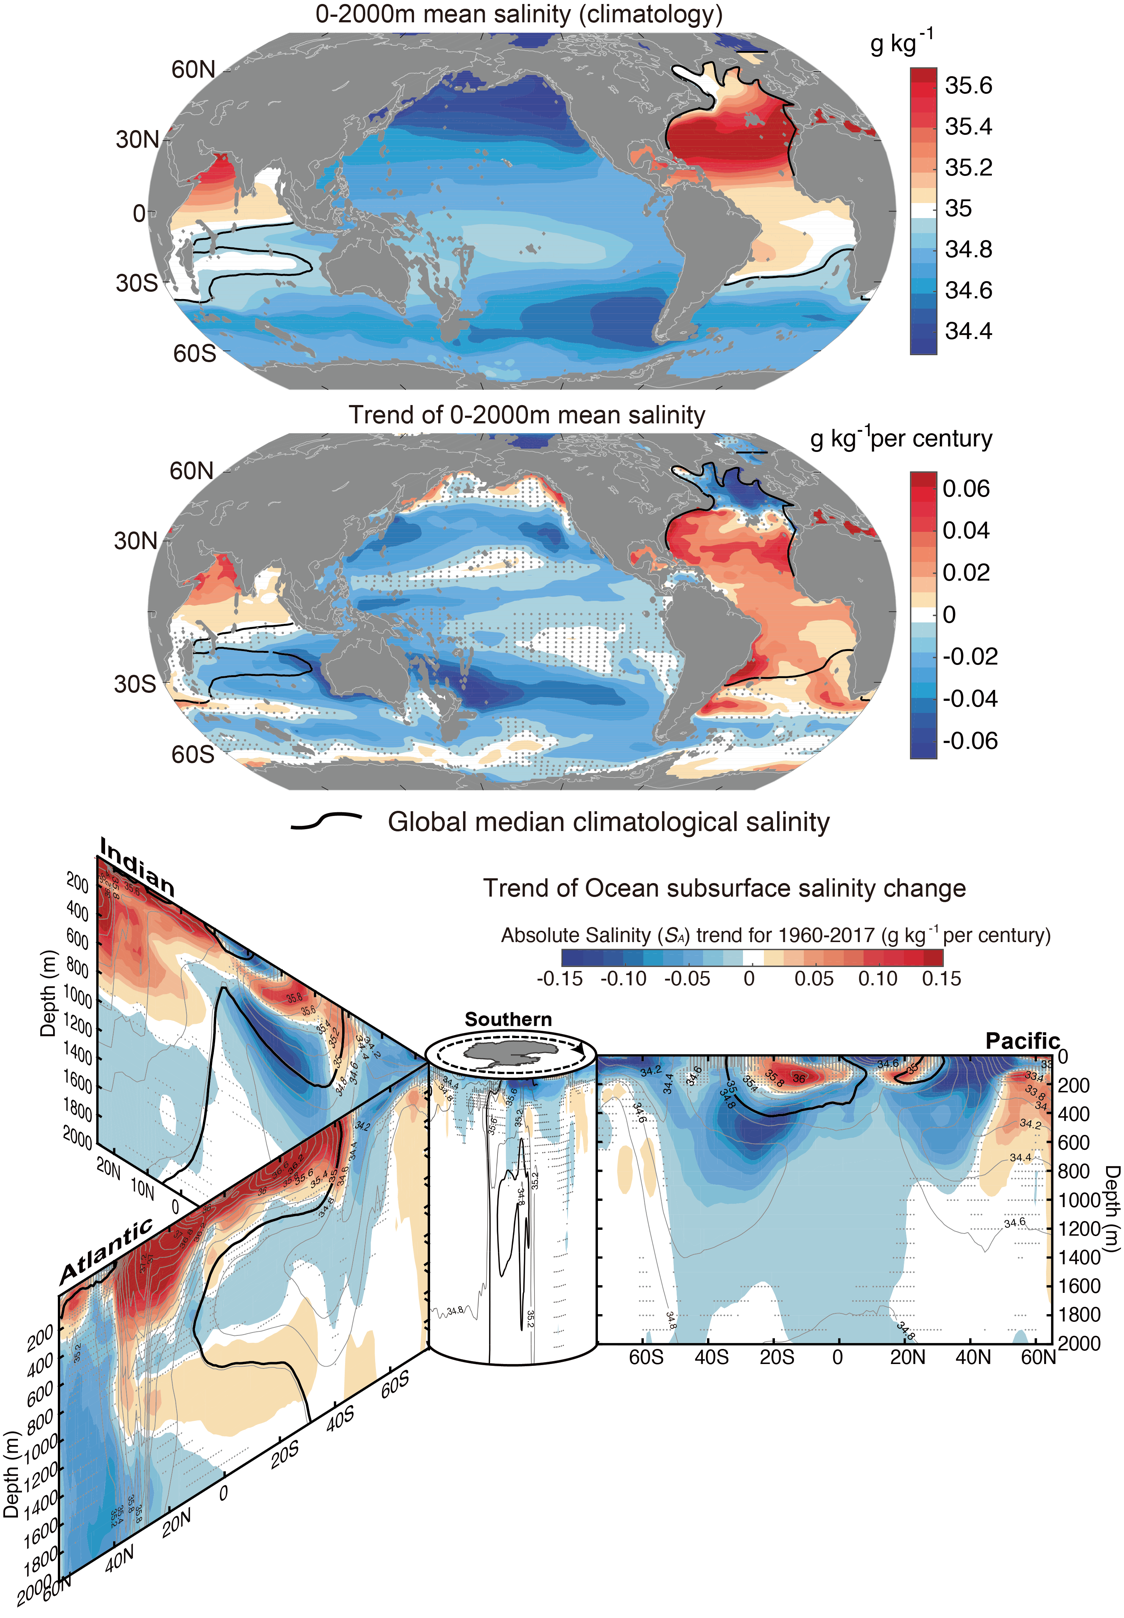
The new data demonstrate that the existing salinity pattern has amplified. In other words, ‘the fresh gets fresher, and the salty gets saltier’ in much of the ocean. In particular, the authors show, for the first time, that the ocean 0-2000m averaged salinity trend indicates freshening in almost the entire Pacific Ocean, broad salinification in the low- and middle-latitudes Atlantic, pronounced freshening in North Atlantic, and contrasts between the north and south Indian ocean” (Figure 2).
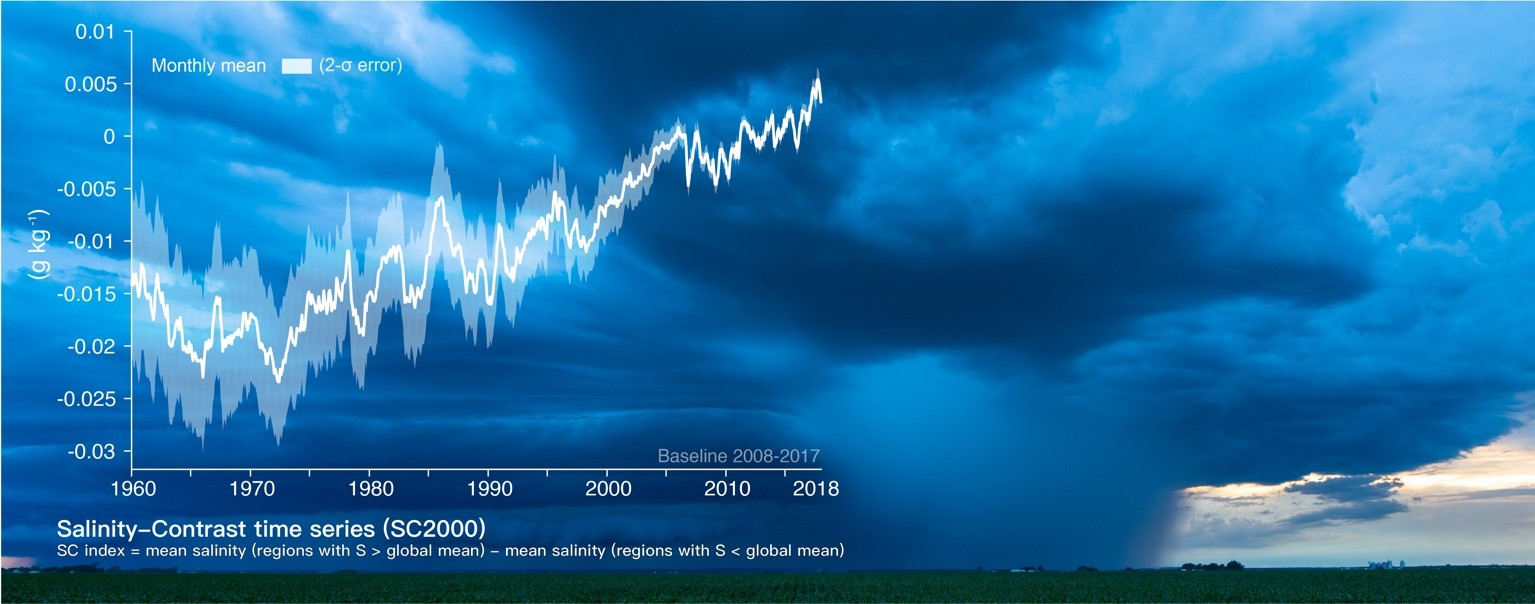
The "Salinity Contrast (SC) index"
As the salinity changes are spatially complex, Cheng et al. use a simple index to synthesize these changes, named the Salinity Contrast (SC) index, which is defined as the difference between the salinity averaged over high-salinity and low-salinity regions (Figure 3). “This metric provides a simple but powerful means of synthesizing the observed salinity pattern changes” said Nicolas Gruber, a coauthor of this study from ETH: “We show that the 0-2000m salinity pattern has amplified by 1.6% and and that at the surface by 7.5%. We also show that this increase is due to human influence, and that this anthropogenic signal has exceeded the natural background variability.”
By combining this improved estimate of the salinity changes with model simulations, the authors demonstrate that the water cycle must have amplified by 2~4 % per degree Celsius since 1960 in order to explain the magnitude and pattern of changes (Figure 1). This ocean-based result is broadly consistent with many recent atmospheric based estimates and strengthens the evidence that global warming intensifies the global water cycle.
Consequences for the future climate
This result has important implications for future climate. This sensitivity to global warming implies an amplification by 4~8% in a world warmed by +2°C (the upper limit of the “Paris Agreement” target). This amplification will be even stronger if the aerosol impacts are smaller in the future than today (i.e. if the air pollution can be controlled). Consequently, there will be stronger evaporation: the drier regions will get even drier and further increase the odds of worsening drought. Droughts affect livestock and crops and increase risk of damaging and sometimes deadly wildfire in many regions, including the U.S., China, Australia, Brazil, and other countries, posing severe risks to food safety and human health.
There will also be greatly increased risk of heavy and extreme rains. The more intense rainstorms cause major problems like extreme flooding around the world. The rainfall associated with tropical cyclones and hurricanes will continue to grow and increase damage not only to coastal and small island communities, but well inland as well (as in Isaias).
“This study is a significant advance in the field”, said Michael Mann from Pennsylvania State University. “First, the new, more accurate estimates of salinity changes provide a better basis for comparison with climate model simulations. Secondly, the Salinity-Contrast index provides a key measure of climate change impact on the global water hydrological cycle and distinguishing the signal. We find that it takes a little more than a decade to isolate the climate change signal from background noise in this particular metric, suggesting it should be used more widely by the climate research community.”
This study is supported by National Key R&D Program of China (2017YFA0603202), Key Deployment Project of Centre for Ocean Mega-Research of Science, CAS (COMS2019Q01), European Union’s Horizon 2020 research and innovation programme under grant agreements 821001 and 821003.
Reference:
Cheng L., K. E. Trenberth, N. Gruber, J. P. Abraham, J. Fasullo, G. Li, M. E. Mann, X. Zhao, Jiang Zhu, 2020: Improved estimates of changes in upper ocean salinity and the hydrological cycle. Journal of Climate. In press, doi: external page https://doi.org/10.1175/JCLI-D-20-0366.1.