Unveiling the fine-scale complexity of the ocean carbon sink
As atmospheric CO2 levels continue their steady climb, the ocean persistently takes up a quarter of our CO2 emissions, curtailing the pace of climate change. But the ocean does not soak up carbon uniformly. Researchers from ETH Zurich and the University of Exeter, Great Britain, released a new product that uses satellites to map the ocean carbon sink at an unprecedented resolution, offering unique insights into its highly variable nature.

While much progress has been made in recent years in understanding the seasonal to decadal variability of the global ocean carbon sink, its higher-frequency variability remains largely unexplored. In particular, current global data products used to constrain the ocean carbon sink have only monthly resolution and a grid spacing of 100 km by 100 km. This is insufficient for detailed analyses of the dynamic nature of the ocean carbon sink.
From local CO2 measurements to a high-resolution global coverage
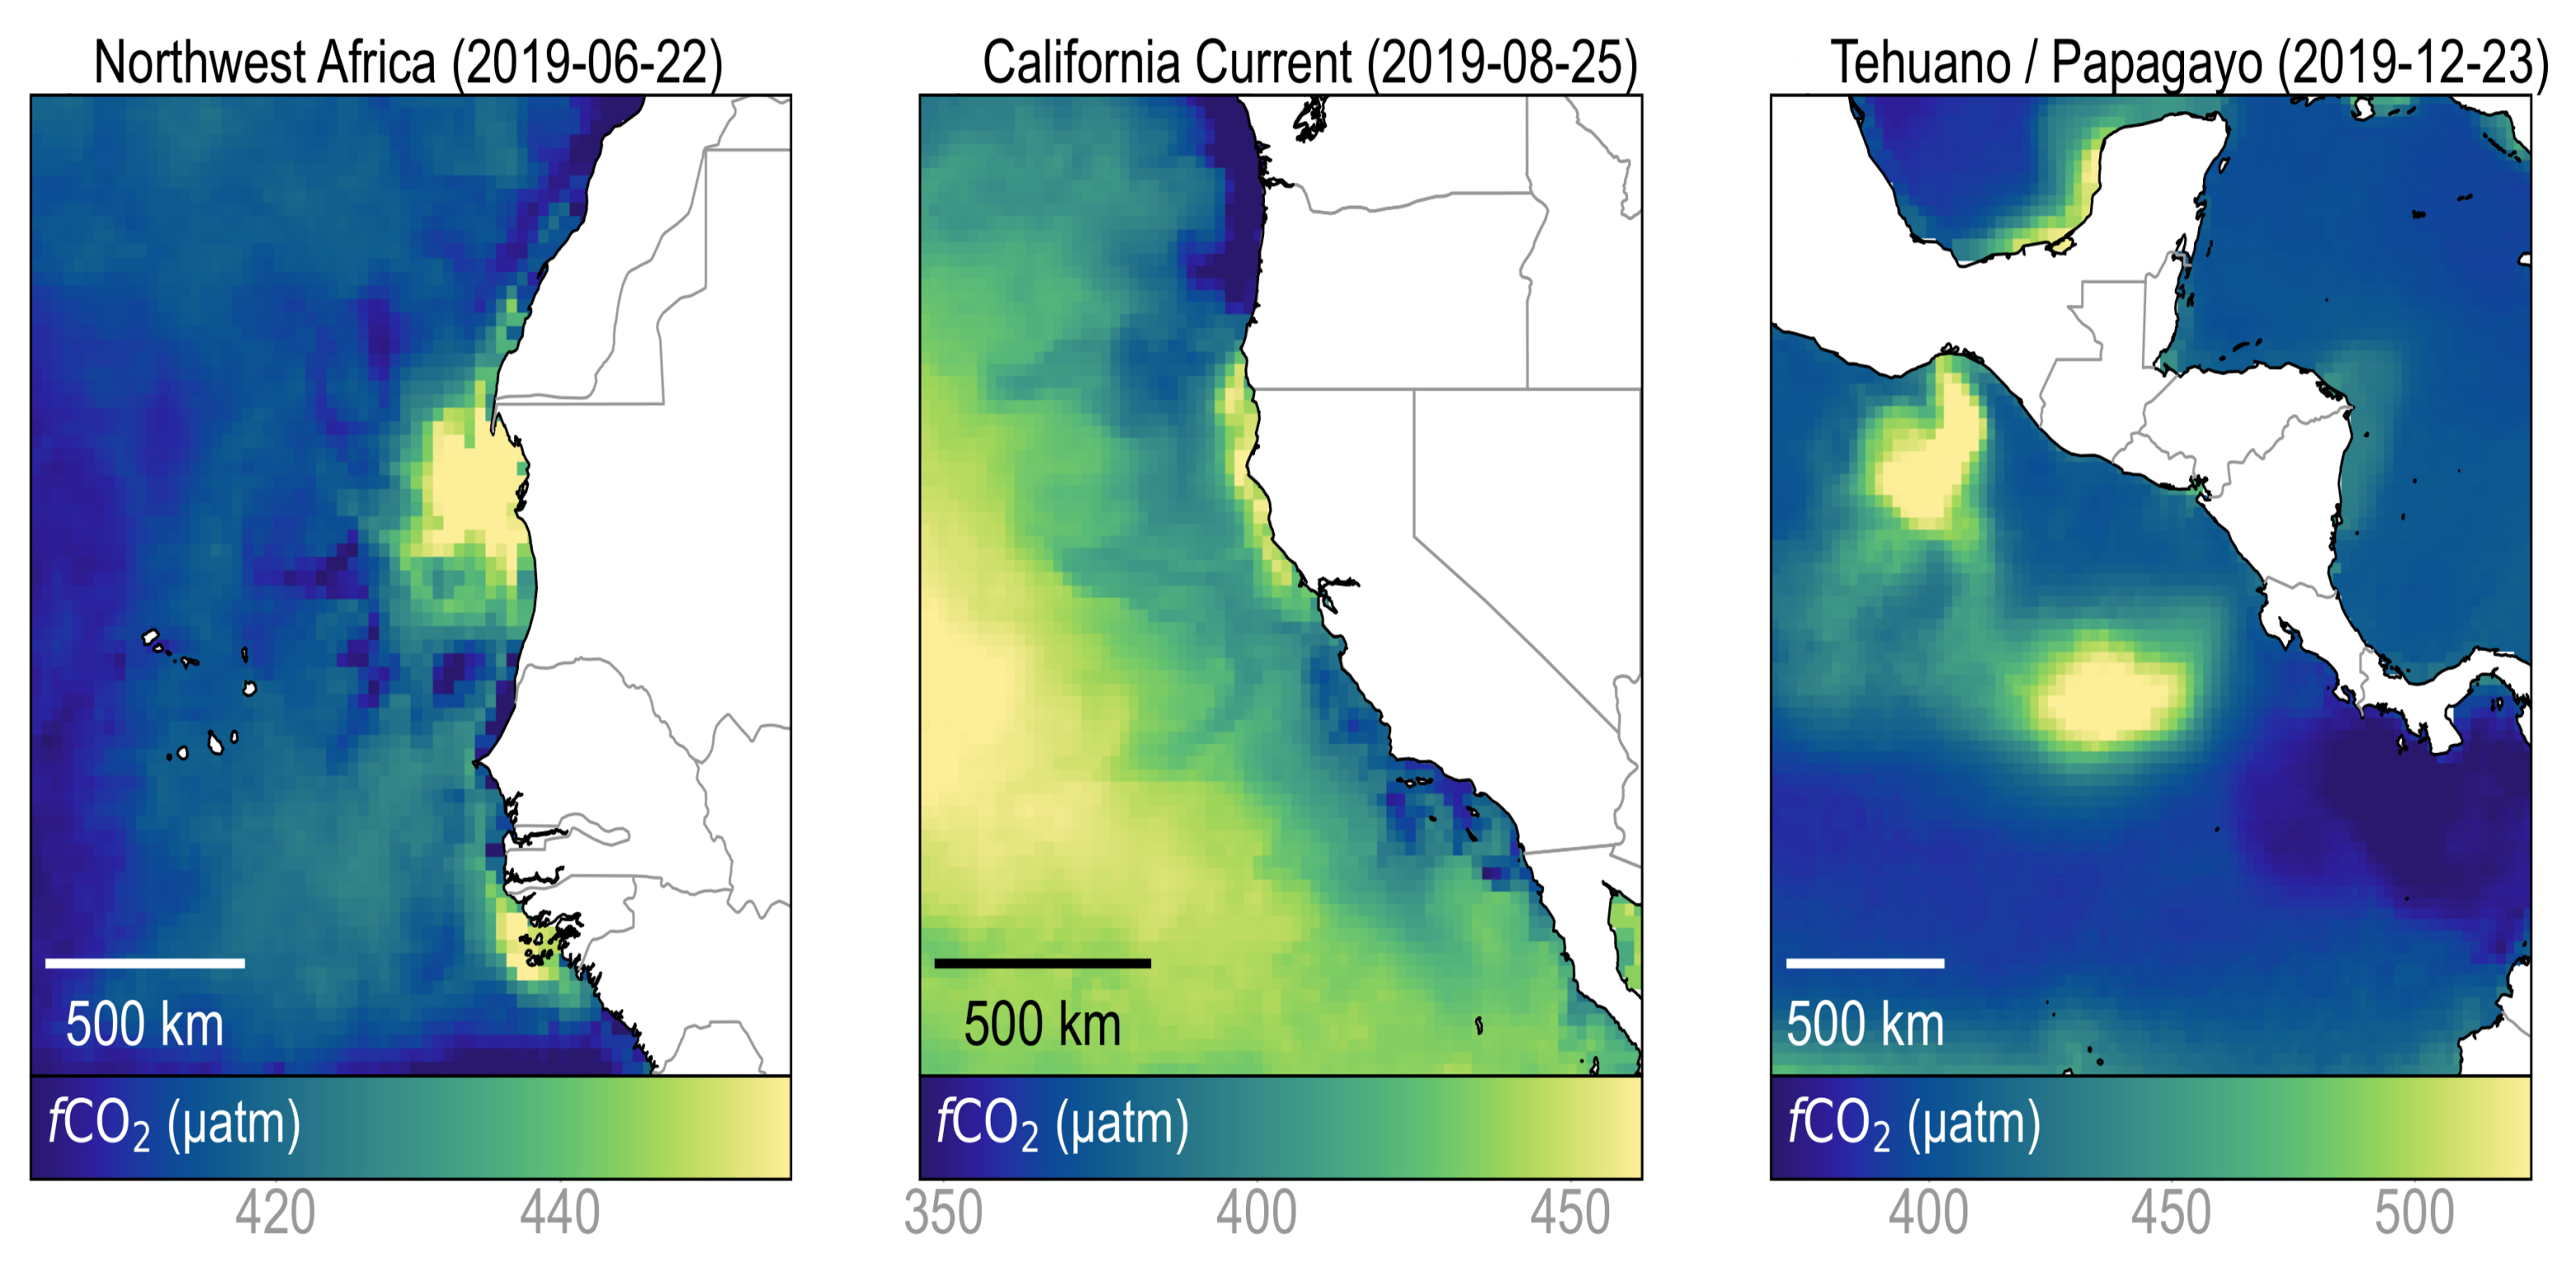
Mapping the global ocean carbon sink is challenging because the available measurements of surface CO2 are sparse in space and time. Leveraging an innovative combination of machine learning techniques, Luke Gregor, a postdoctoral researcher in Nicolas Gruber's Environmental Physic group, produced a new version of their OceanSODA-ETHZ product, achieving an unprecedented resolution of 8 days and 25 km by 25 km. The method notably relies on satellite data that provides a crucial set of high-resolution predictors.
This new product shows that the sub-seasonal variability it now captures accounts for a substantial fraction of the total variability, while the overall estimate of the global carbon sink remains largely unchanged.
A leap forward in understanding the ocean carbon sink
As showcased in an accompanying study published in Global Biogeochemical Cycles, the new product also offers invaluable insight into the impacts of sporadic intense events. For example, the high resolution of the dataset permits to disentangle the effects of hurricanes or upwellings on the physics and biology of the ocean which result in strong CO2 anomalies.
By providing insight into fine-scale processes, this new high-resolution product paves the way for more in-depth research into the mechanisms governing the ocean's carbon sink and its future changes. This understanding is increasingly critical as climate dynamics shift and the ocean emerges as a viable candidate for carbon removal strategies.
Further information
- Gregor L, Shutler J, Gruber N: High-Resolution Variability of the Ocean Carbon Sink. Global Biogeochemical Cycles, 22 August 2024, doi: external page 10.1029/2024GB008127
- Surface ocean sea-air CO2 fluxes from 1982 to 2022 (8-day by 0.25° x 0.25°): external page Dataset